Scholarly search engine for George Mason University that links researchers to research resources. Has advanced filters, admin view for uploads and edits, and LLM-generated metadata.
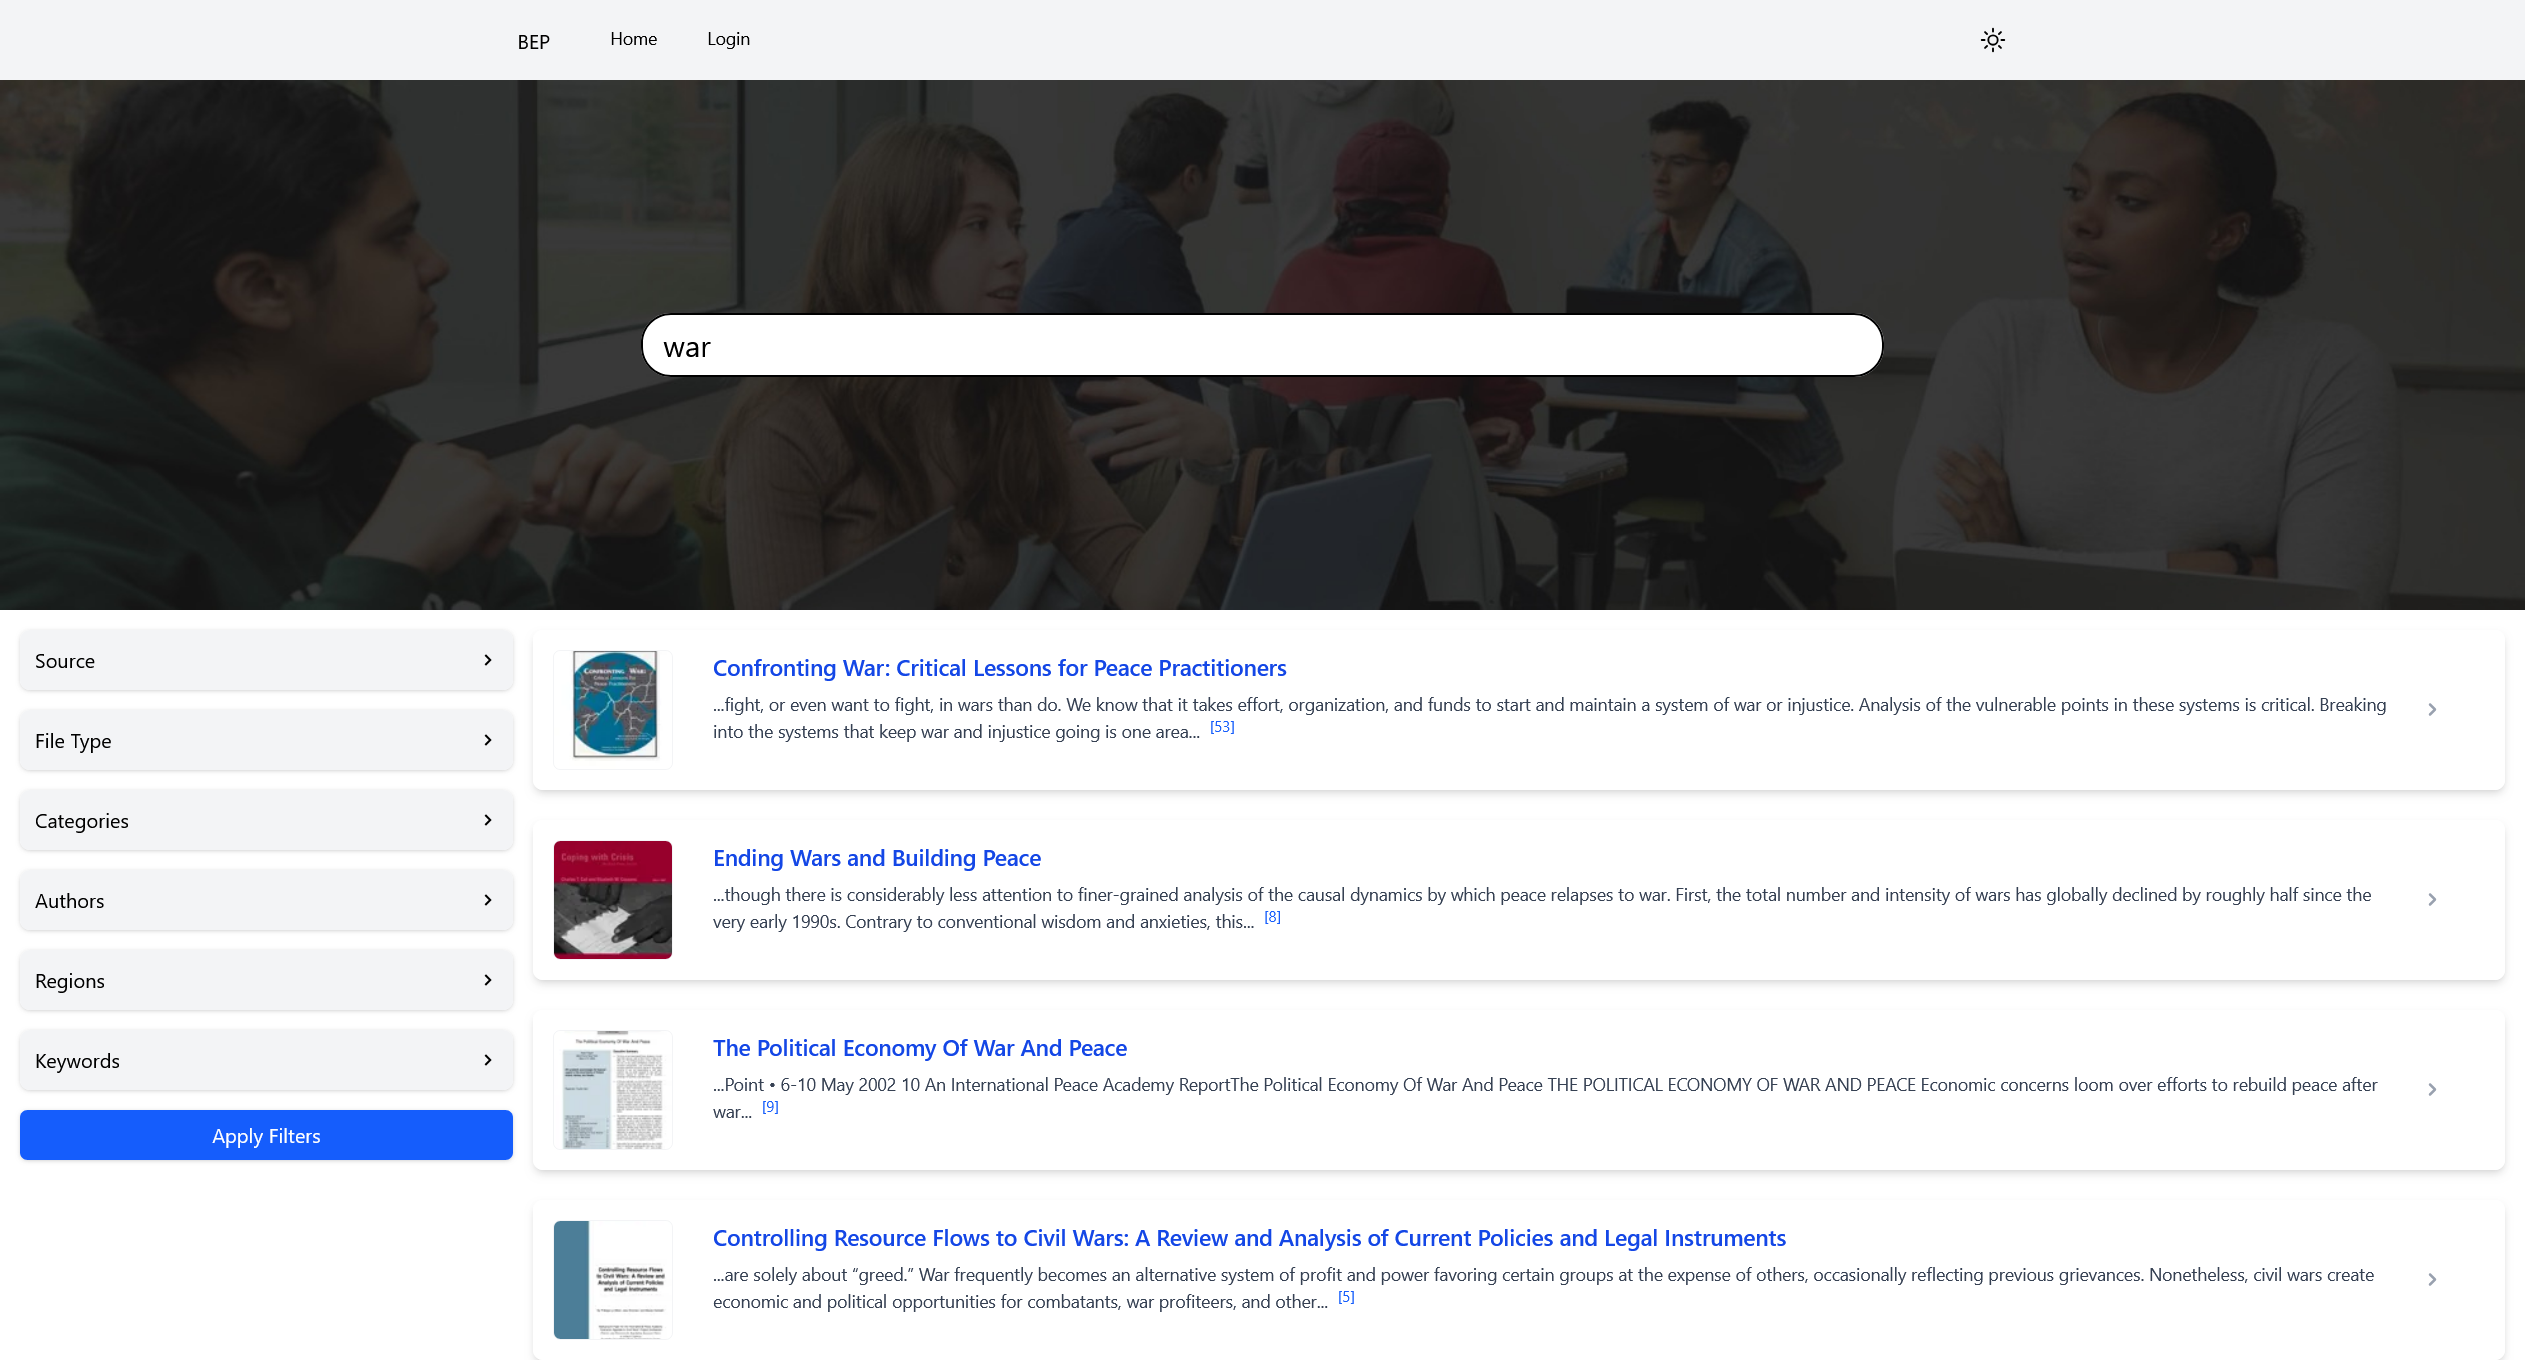
GMU - Better Evidence Project
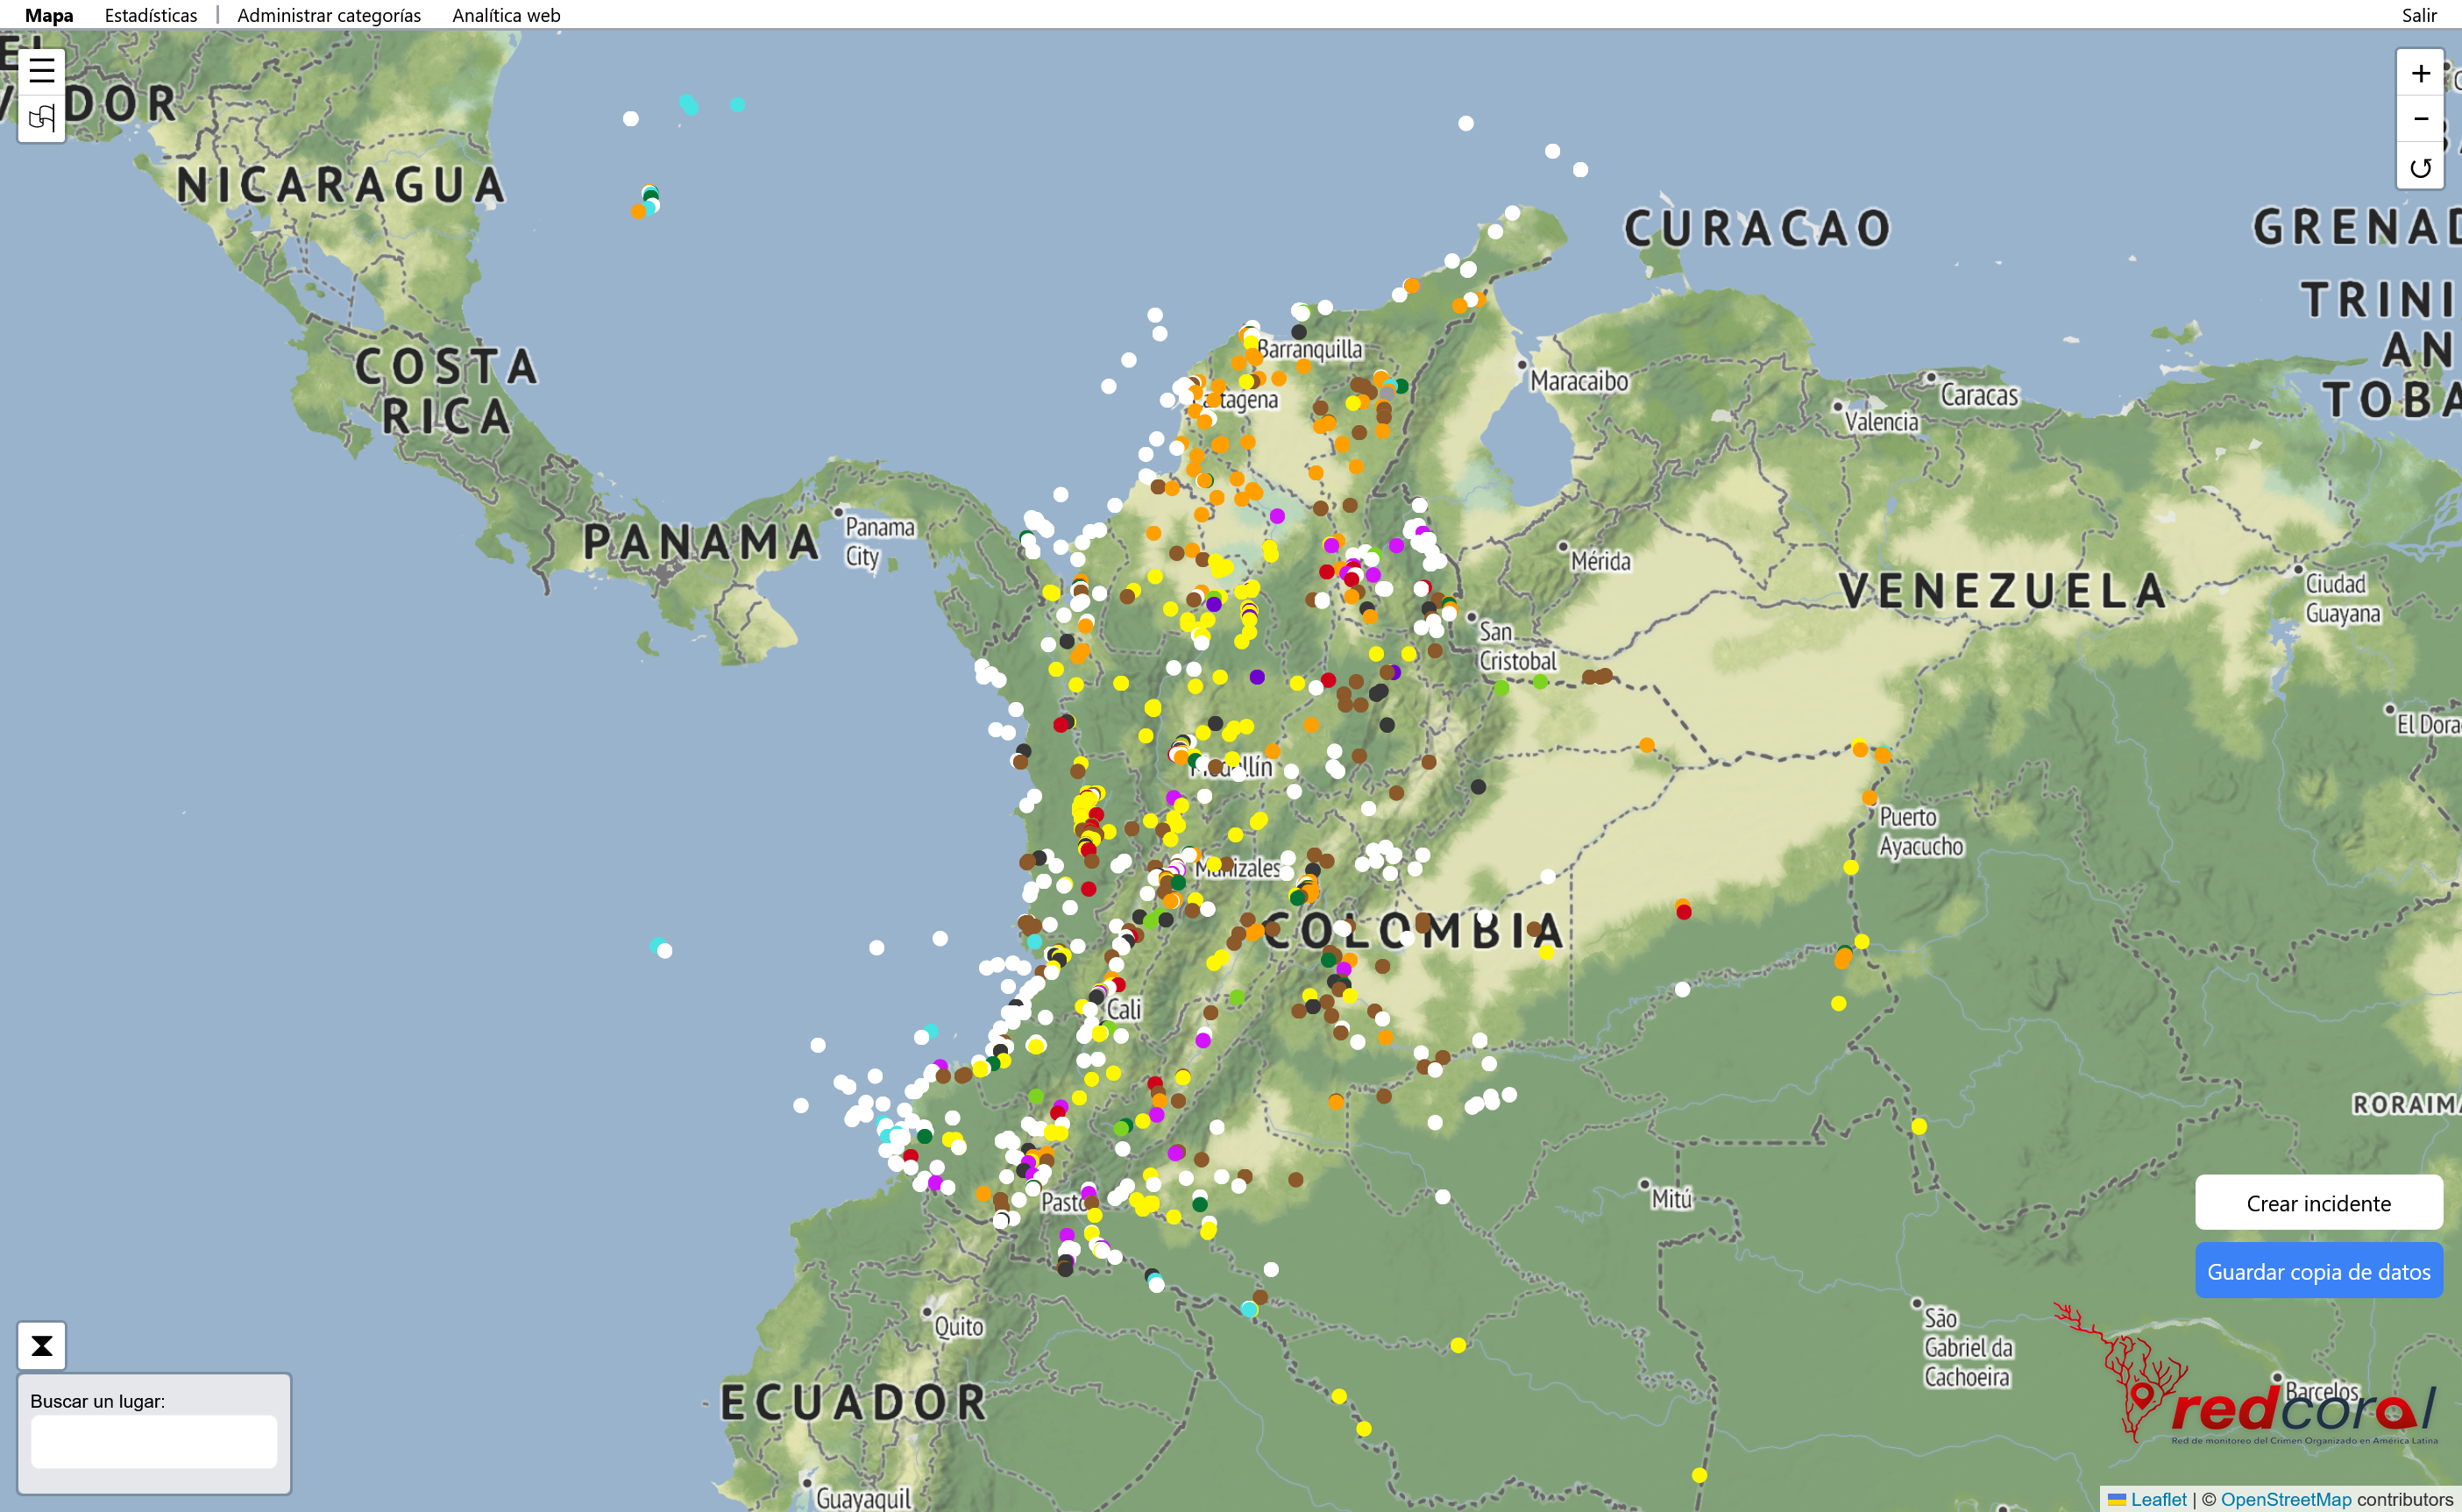
Red-CORAL
Created an interactive map for Red-CORAL, a non-profit cataloguing organized crime in South America. There are over 1,200 documented data points with dates, locations, and descriptions, and a statistics dashboard to explore the data. Check it out here.
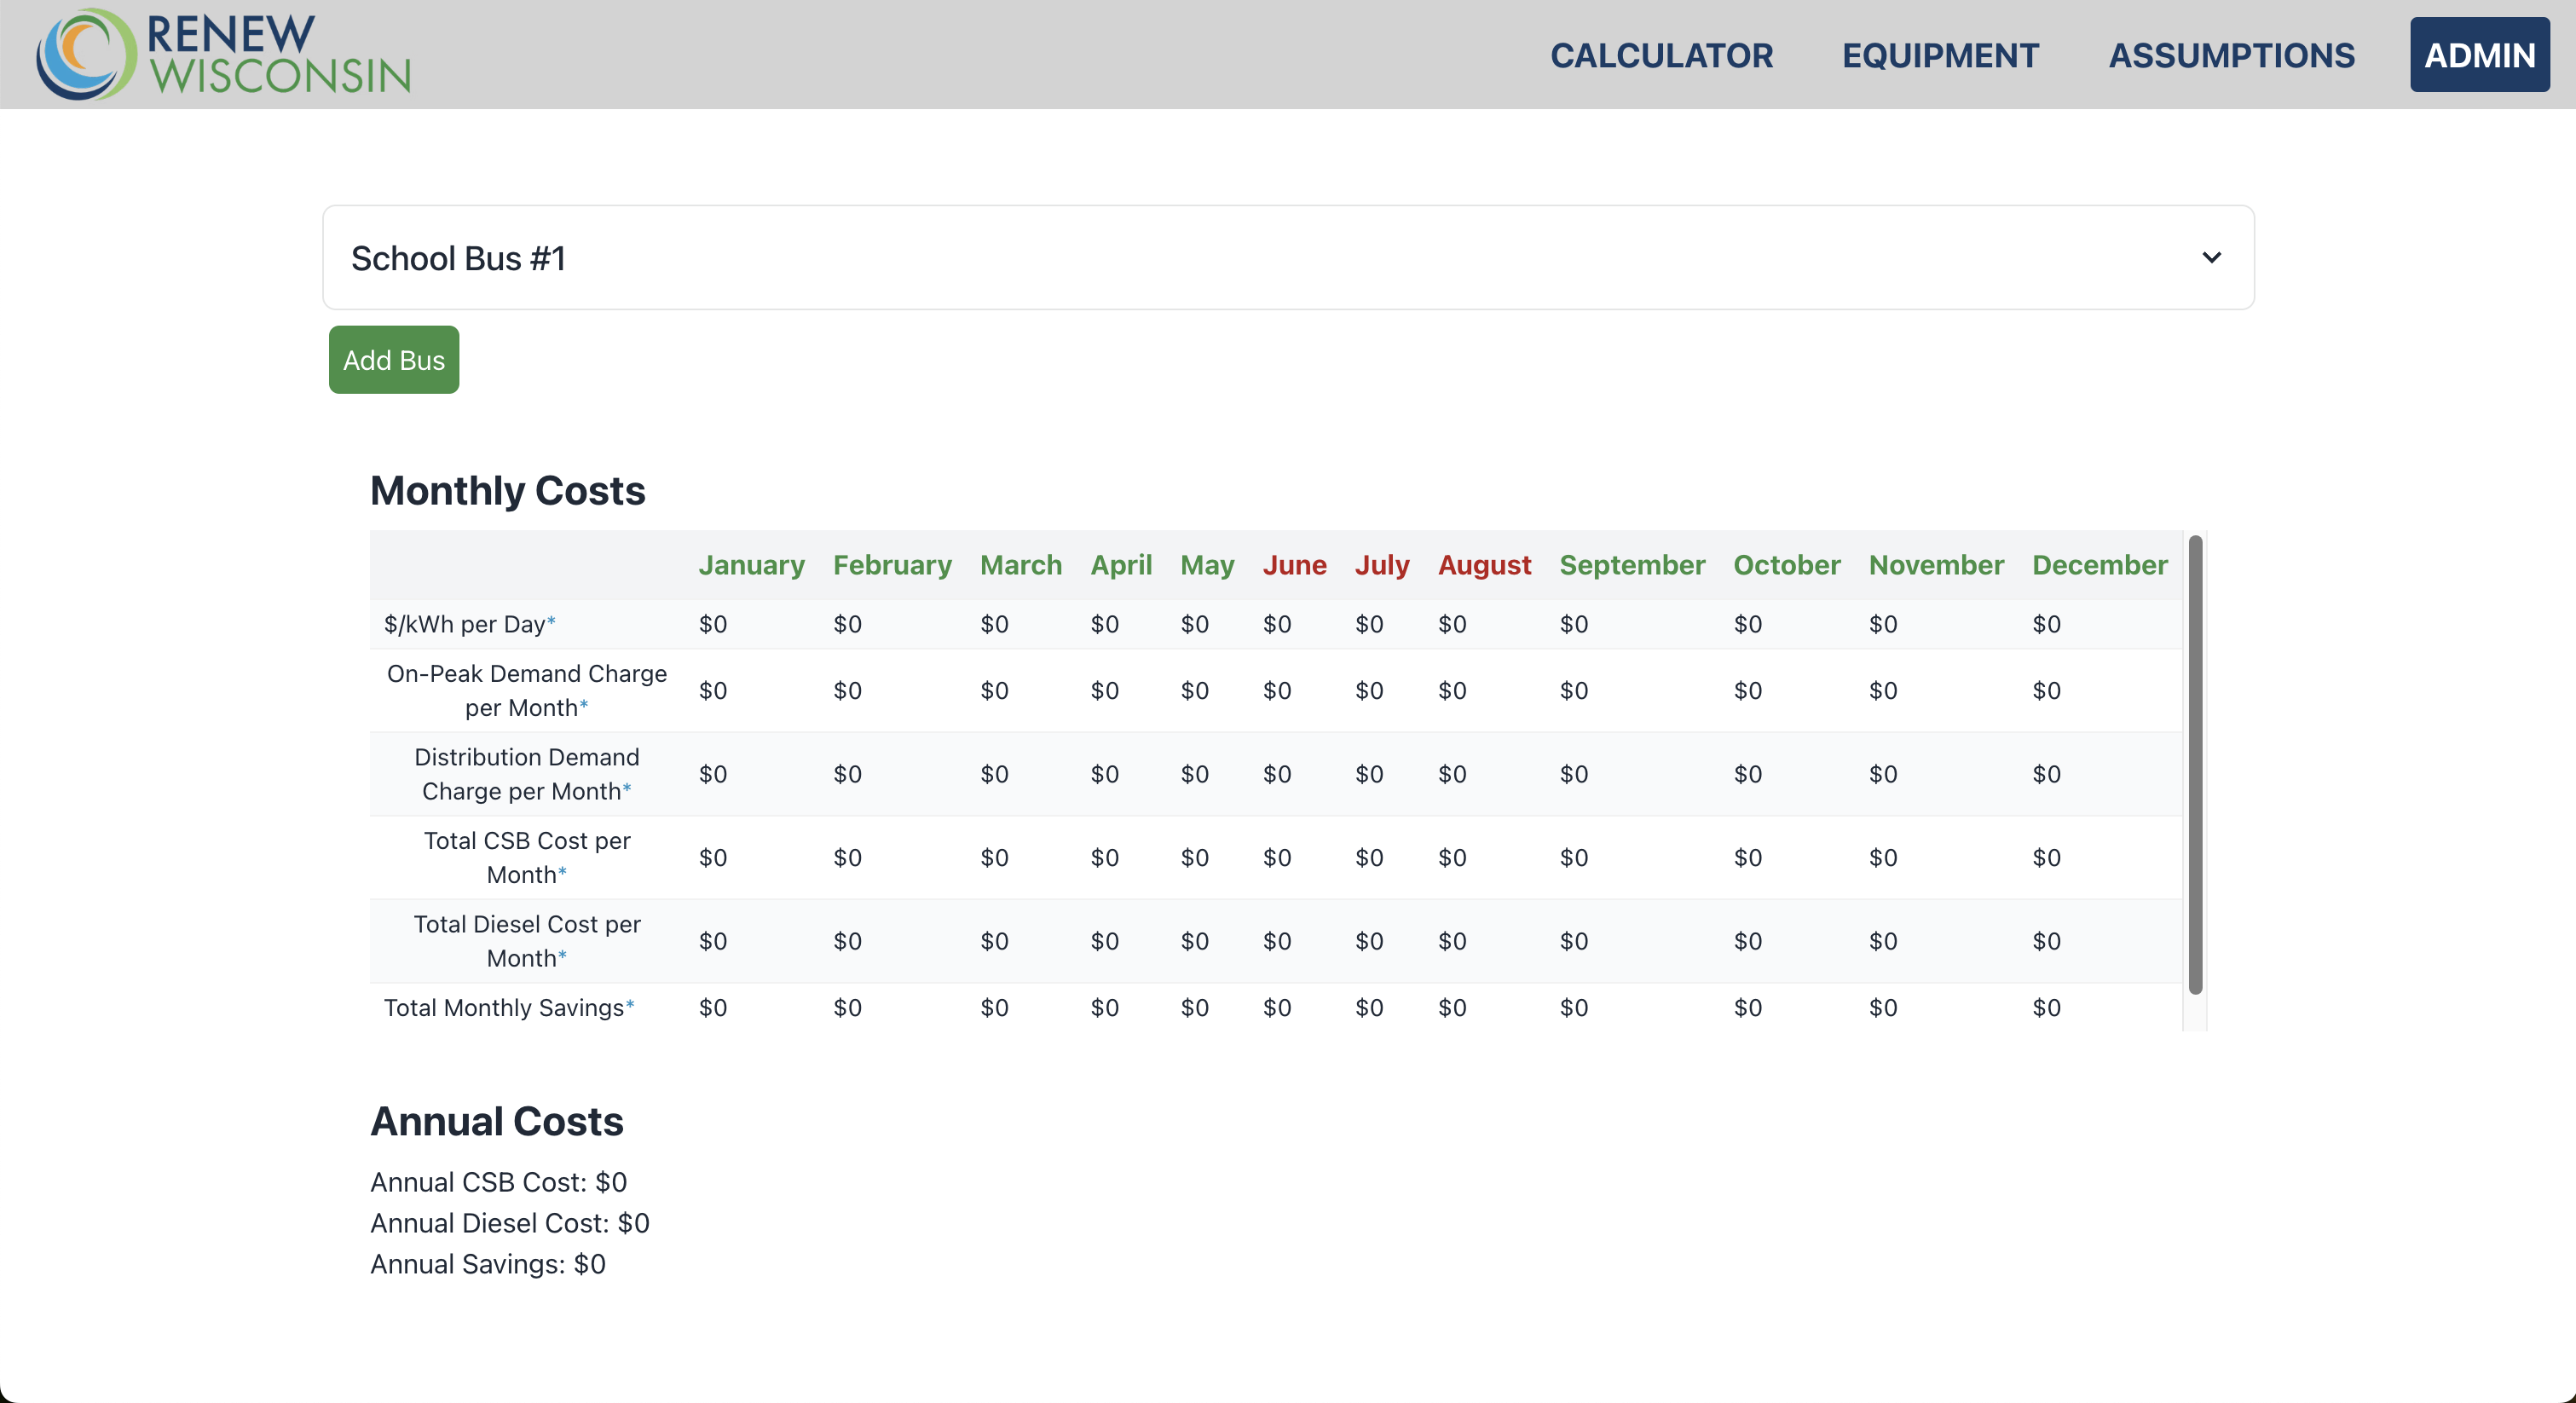
RENEW Wisconsin
Partnered with RENEW Wisconsin to convert their Electric Bus Cost Savings Calculator into a web interface. The calculator’s purpose is to aid school districts in interpreting and visualizing the benefits of investing in electric school buses. Check it out here.
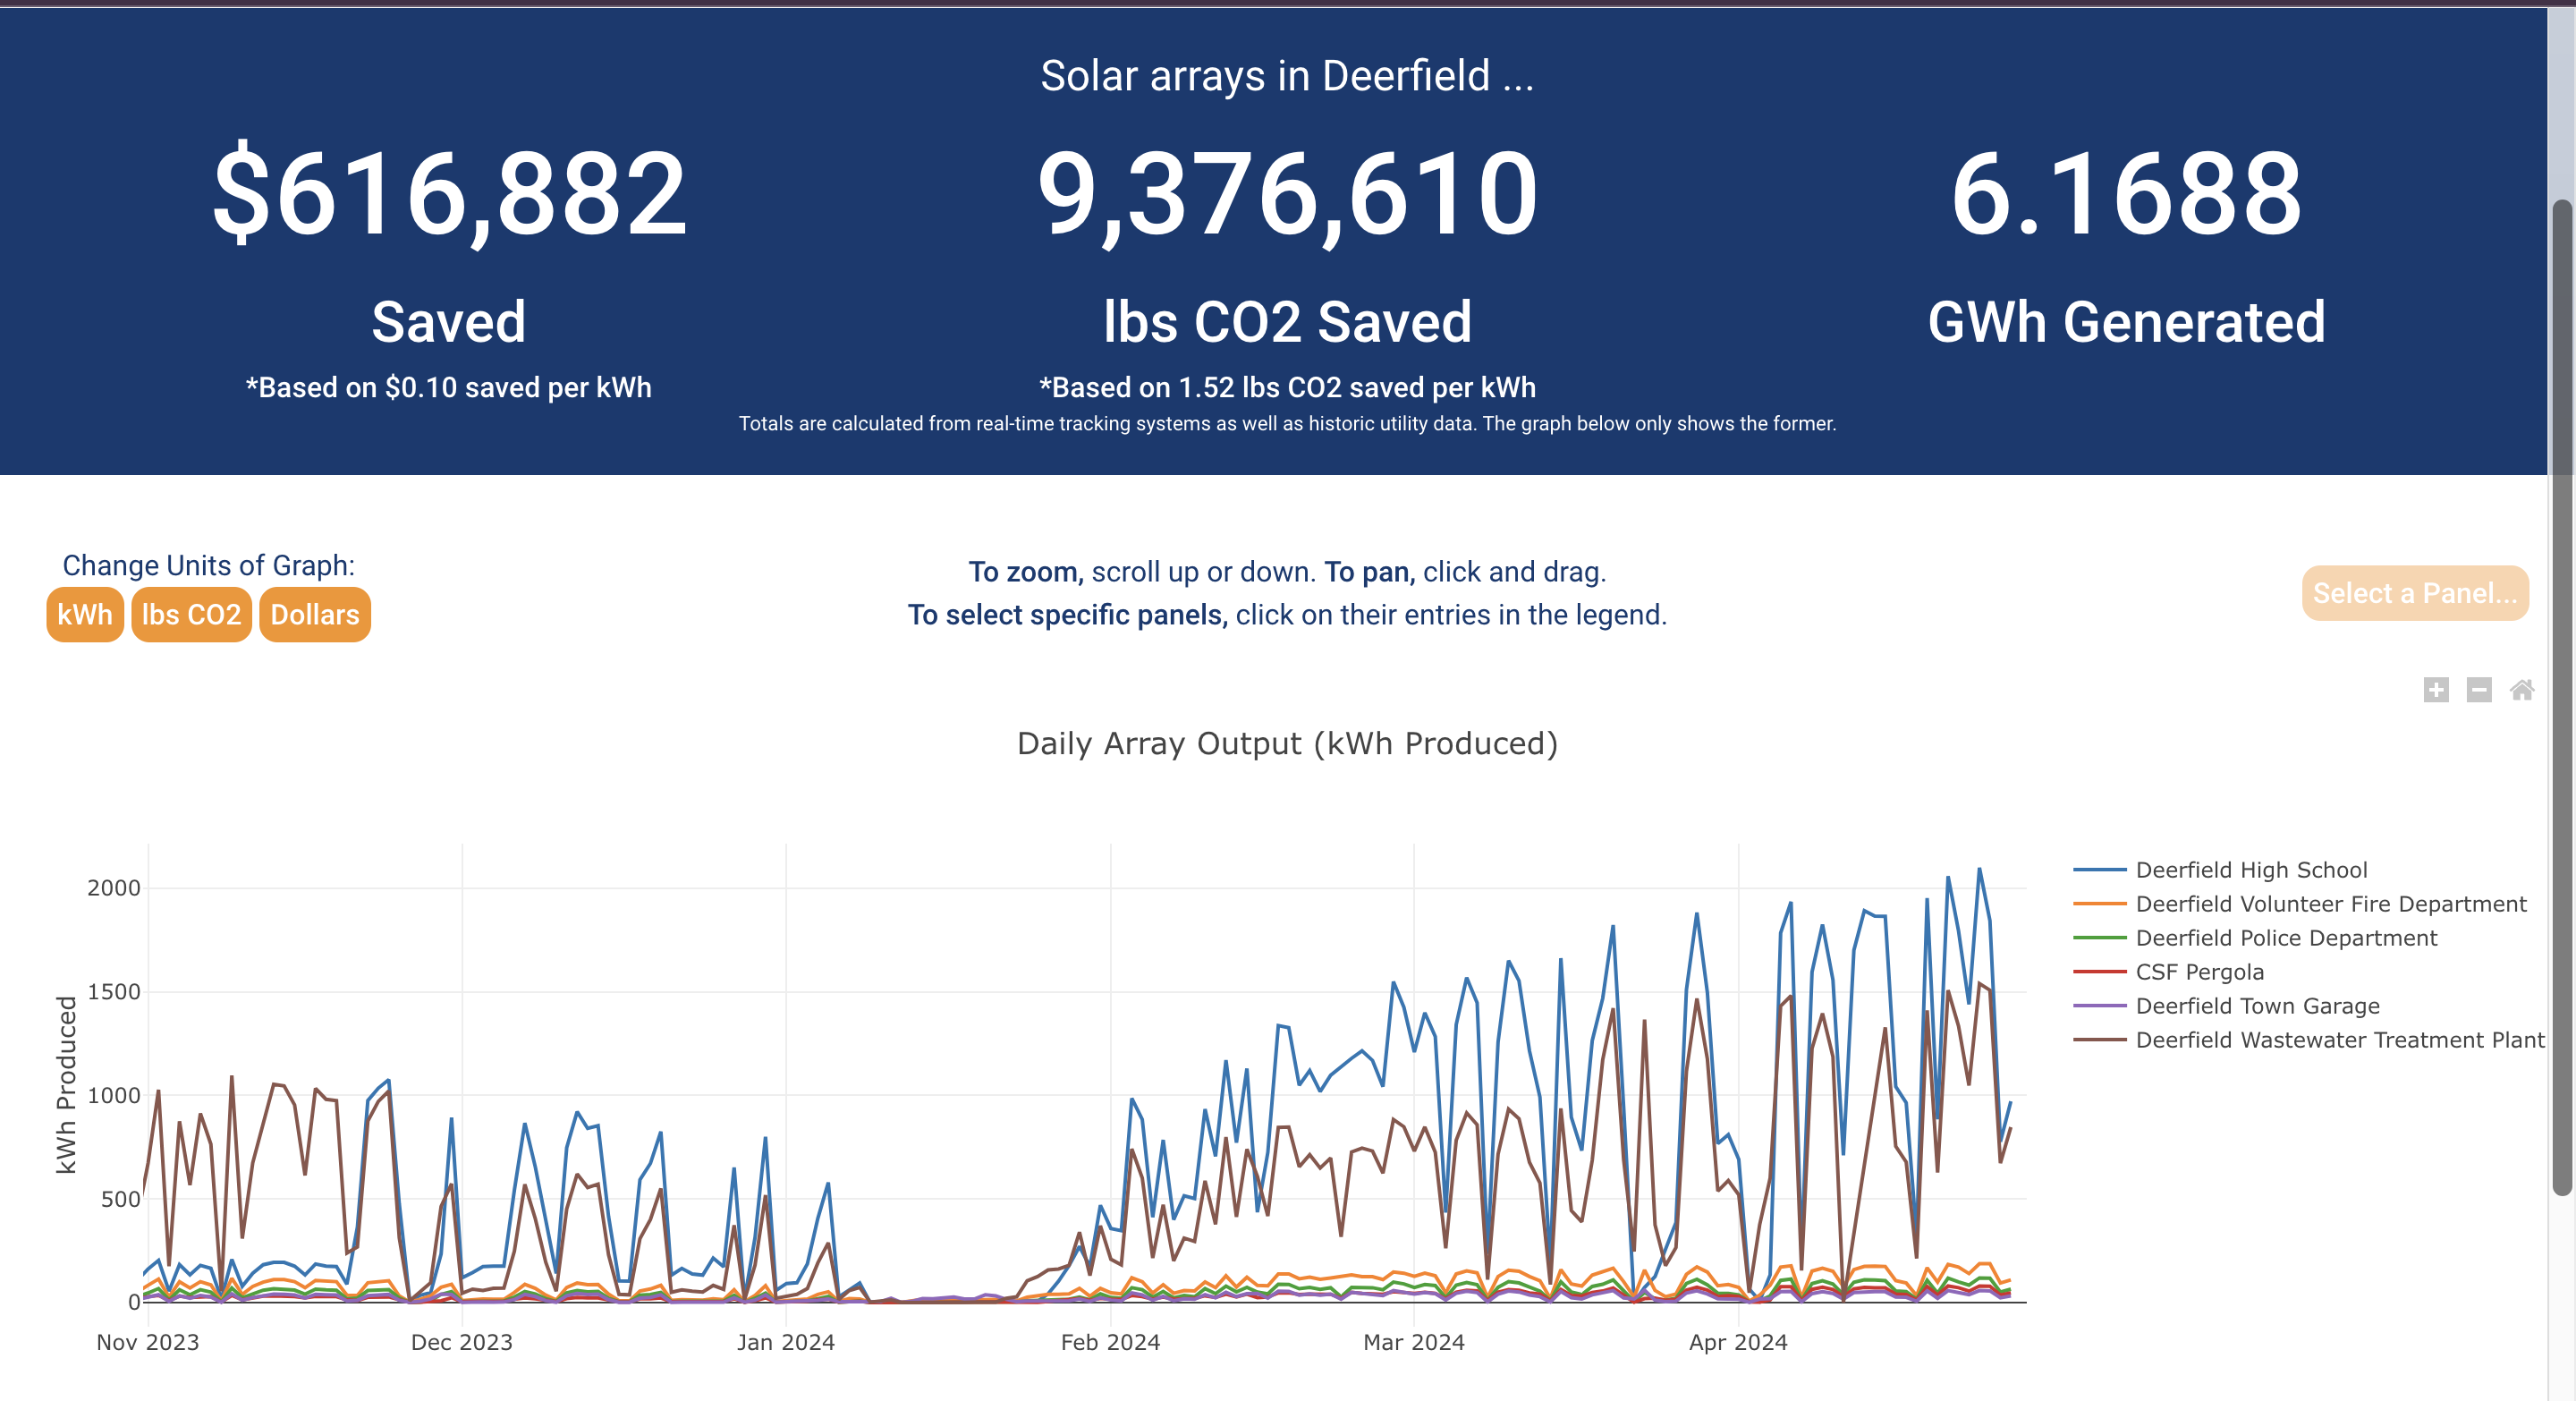
Couillard Solar Foundation
Dashboard with cumulative energy, cost, and emissions saved by solar arrays in Deerfield, WI. Check it out here.
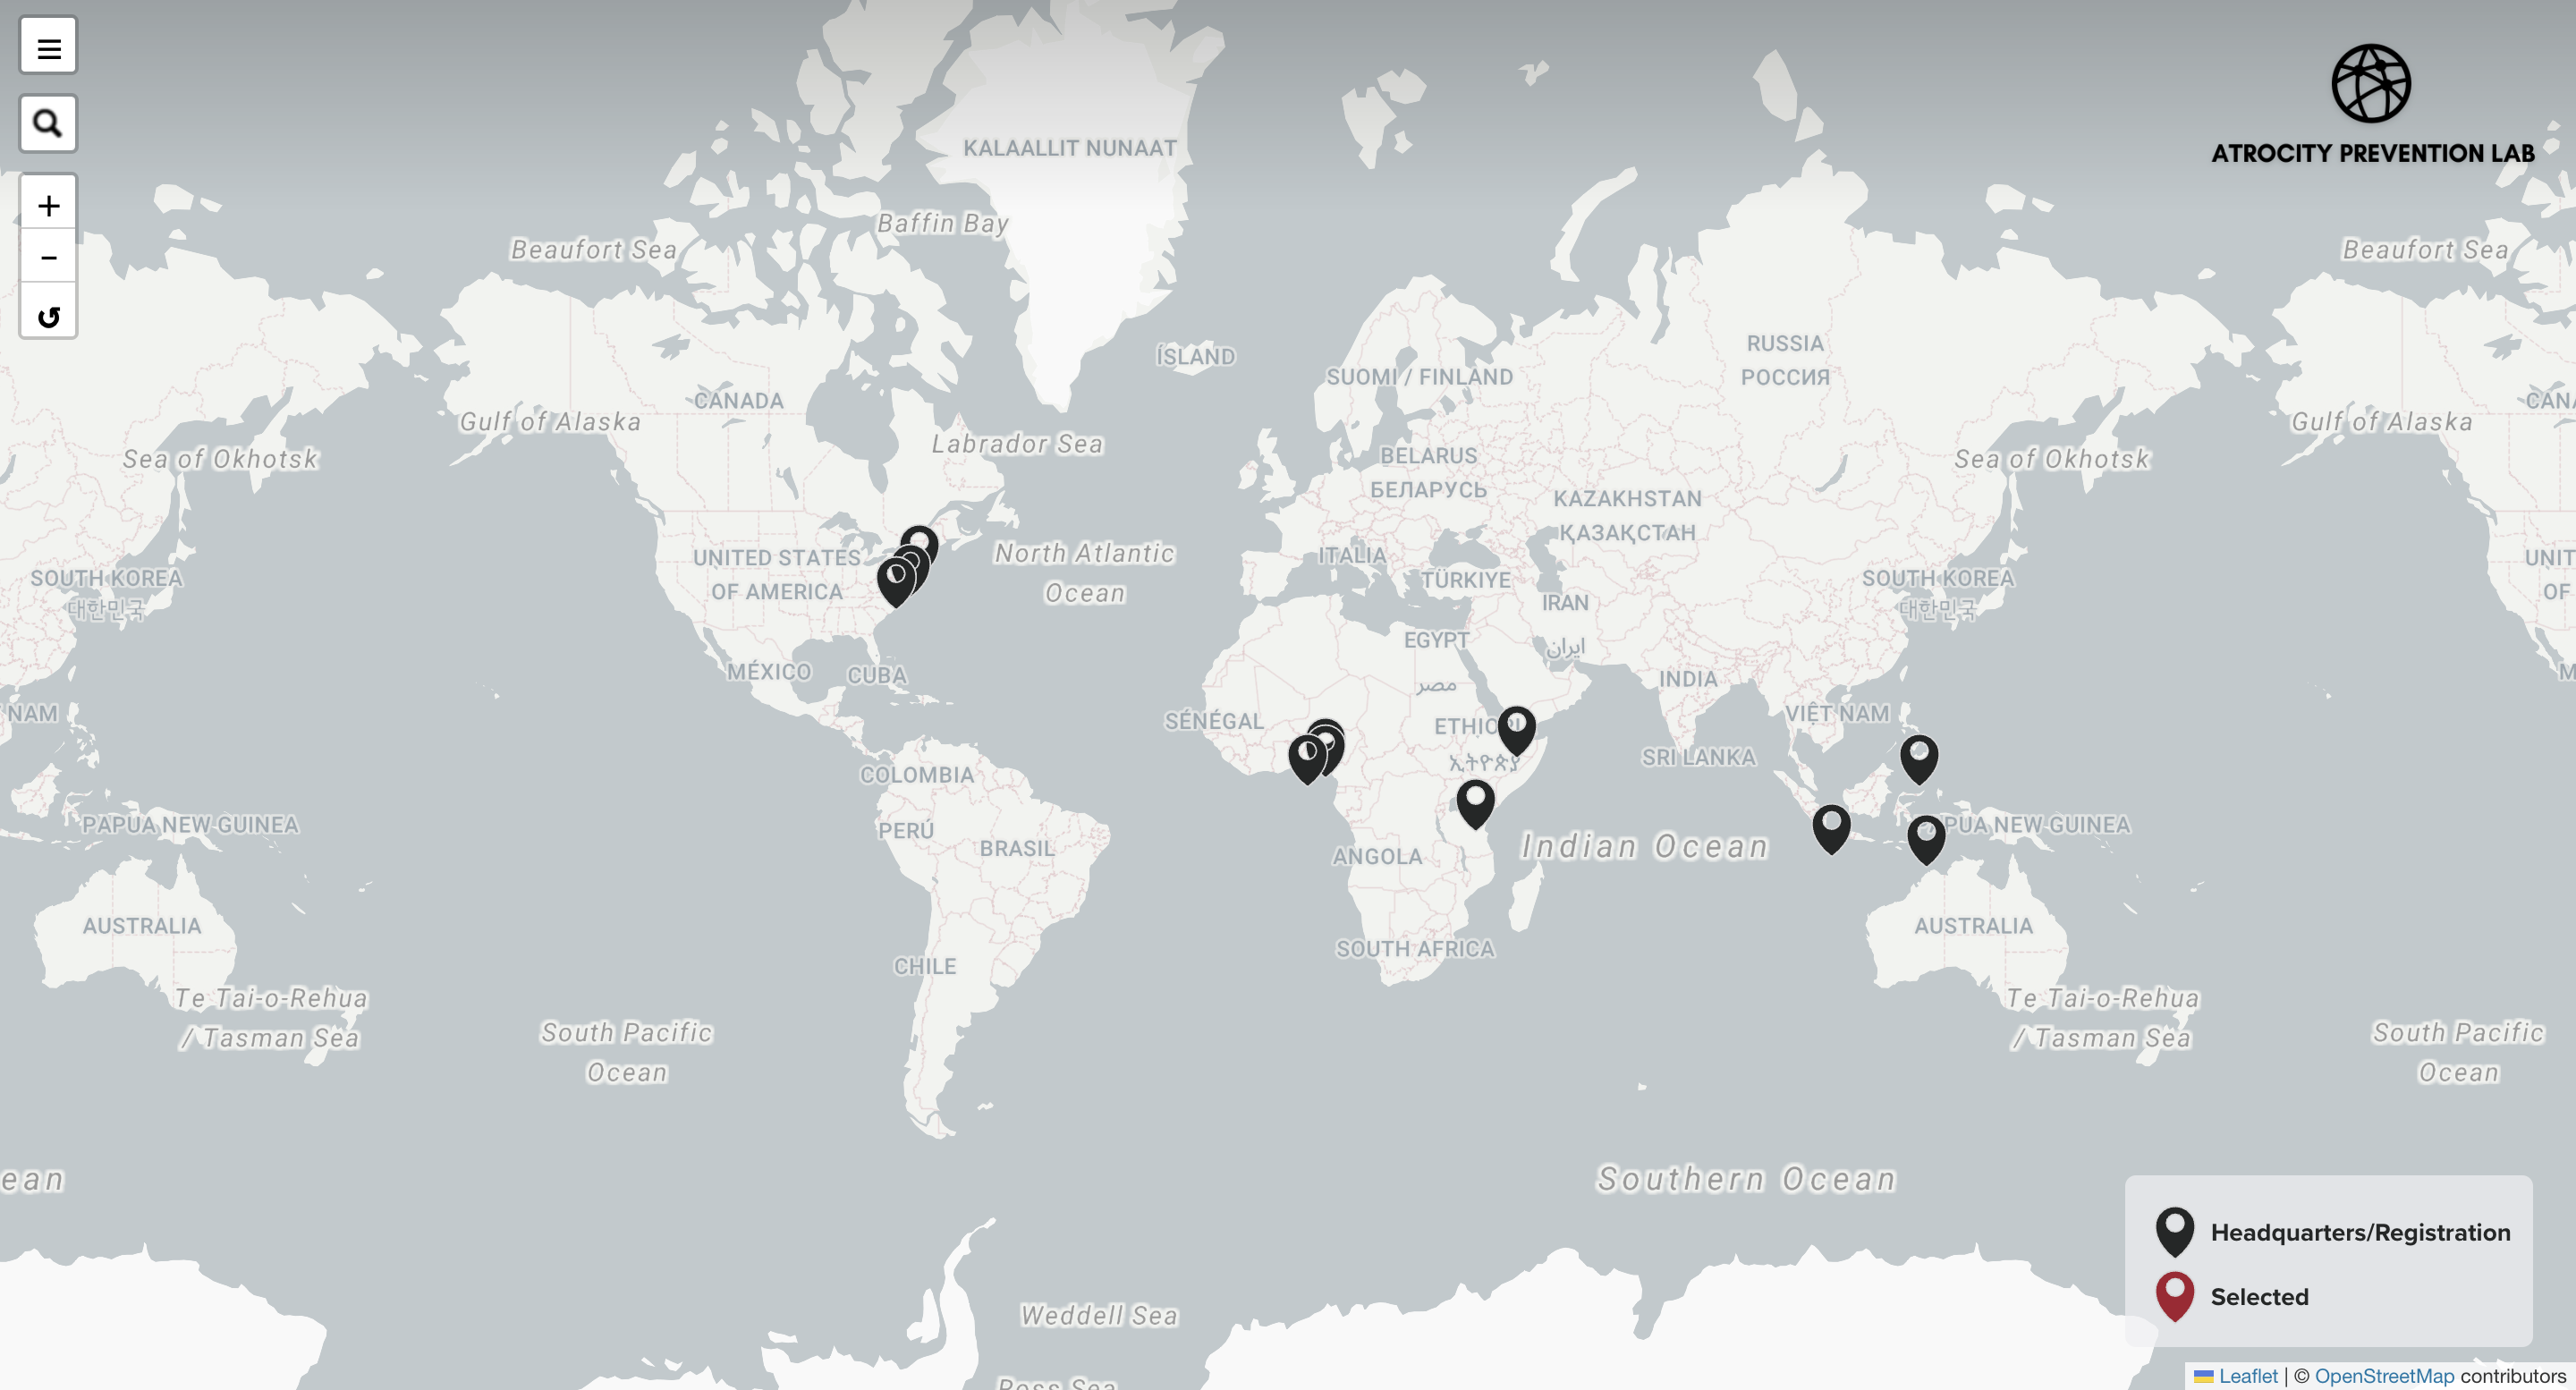
Harvard Humanitarian Initiative
Interactive map of stakeholders in Harvard Humanitarian Initiative's Signal Program on Human Security and Technology. Check it out here (HHI is working on entering the data still).
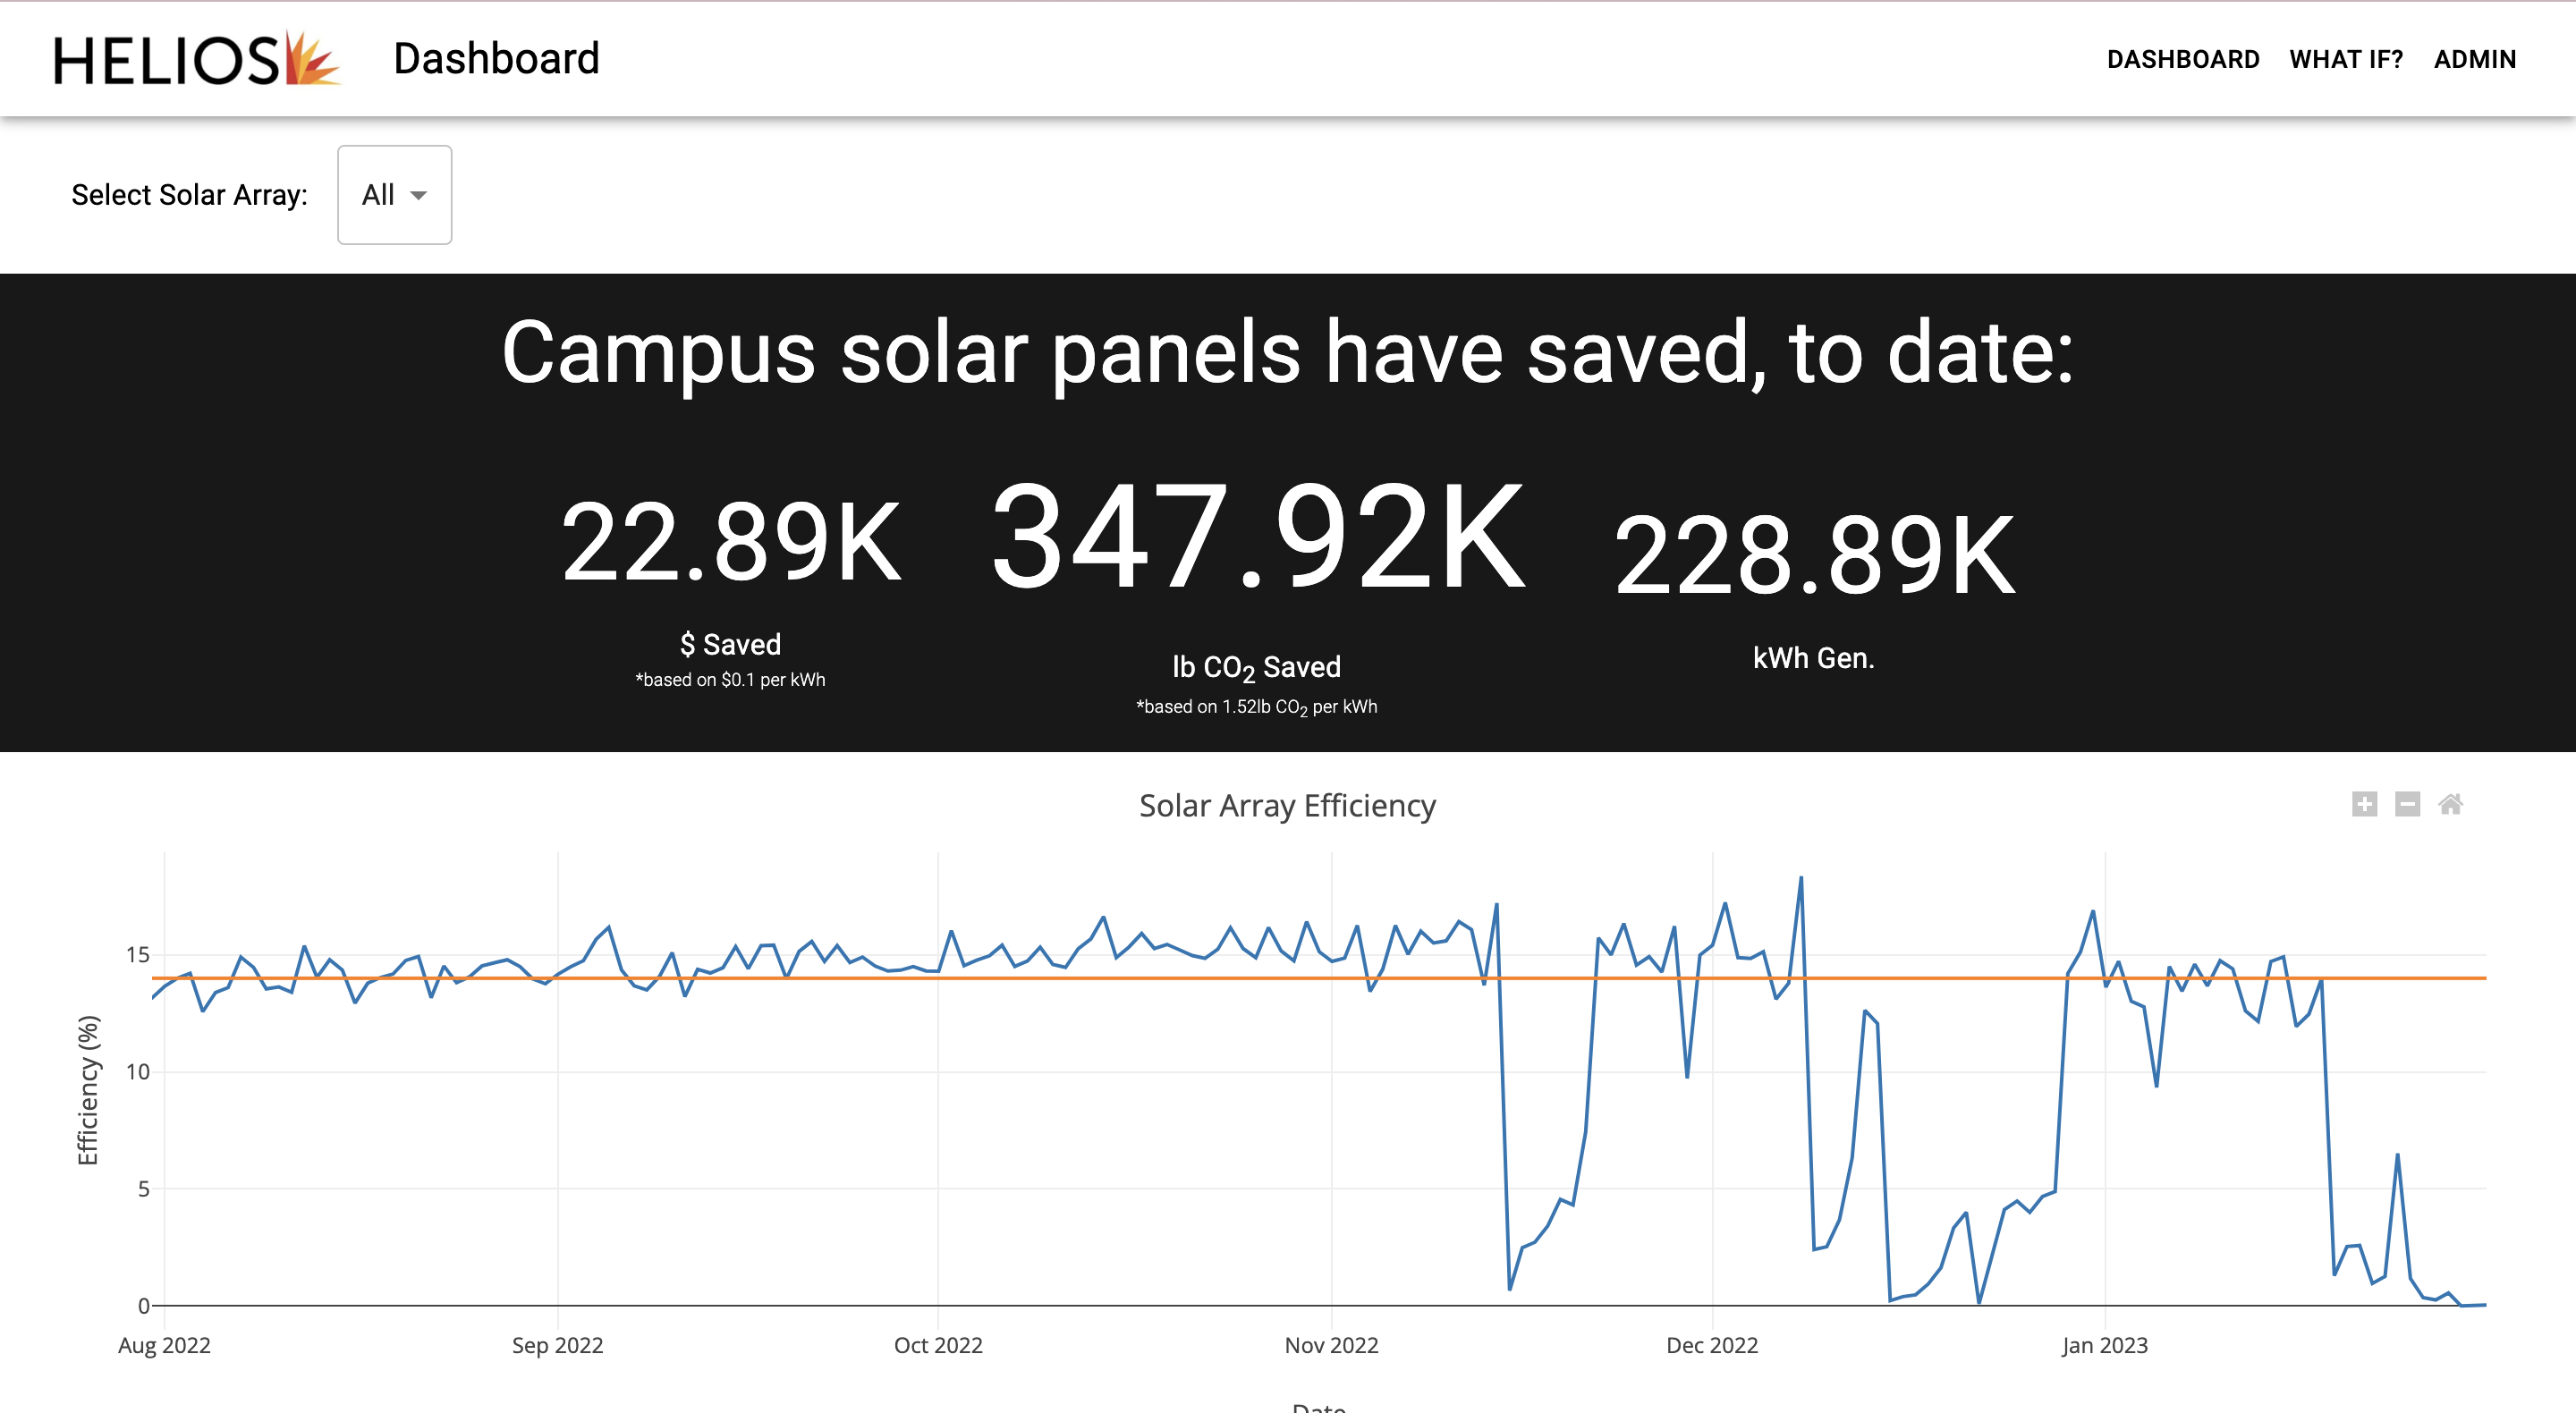
Campus Solar Anlytics
Web app that displays interactive graphs with efficiency data for campus solar arrays based on data collected from the arrays themselves and an irradiance tracker on our engineering building. The site also projects savings that could be achieved if some proposed solar arrays are installed. Check it out here.
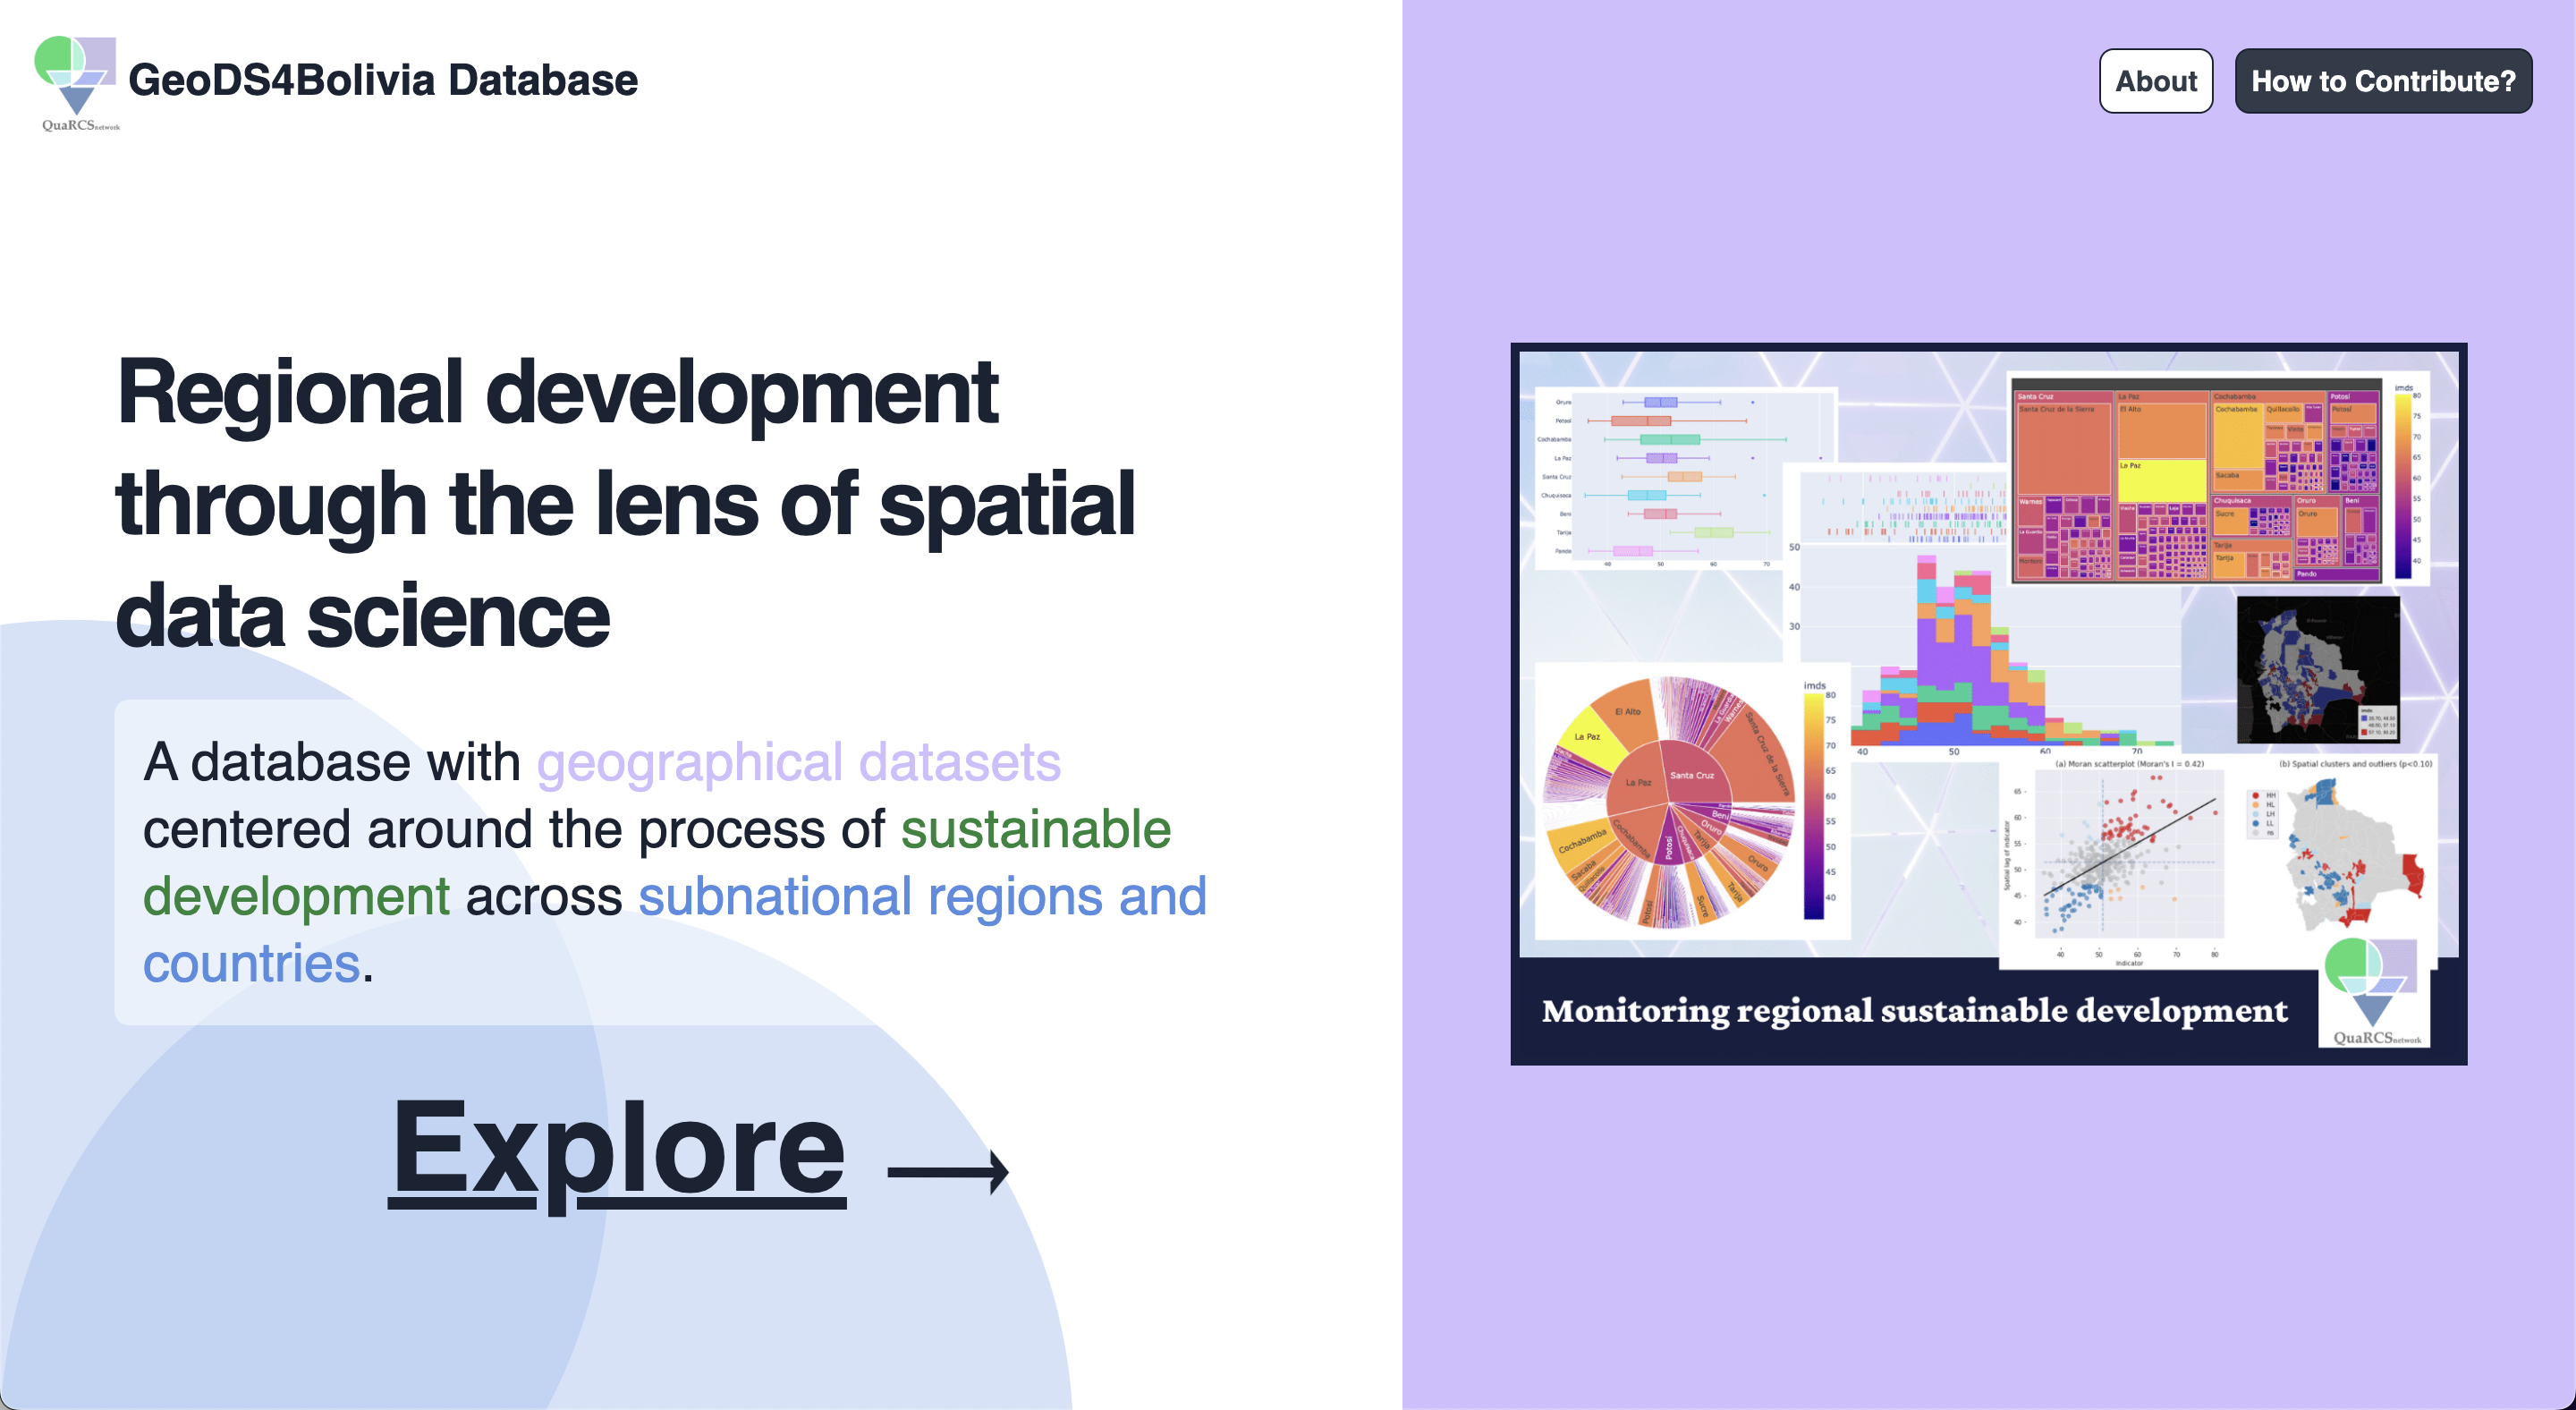
GeoDS4Bolivia Interactive Database
Project in collaboration with Nagoya University's QuaRCS Lab. Platform that allows users to browse, create, and share stories about their analysis on the GeoDS4Bolivia Dataset. Stories can have embedded graphs from python notebooks. Users who view stories can open their notebooks and use the code for their own tangential analysis. Check it out here.
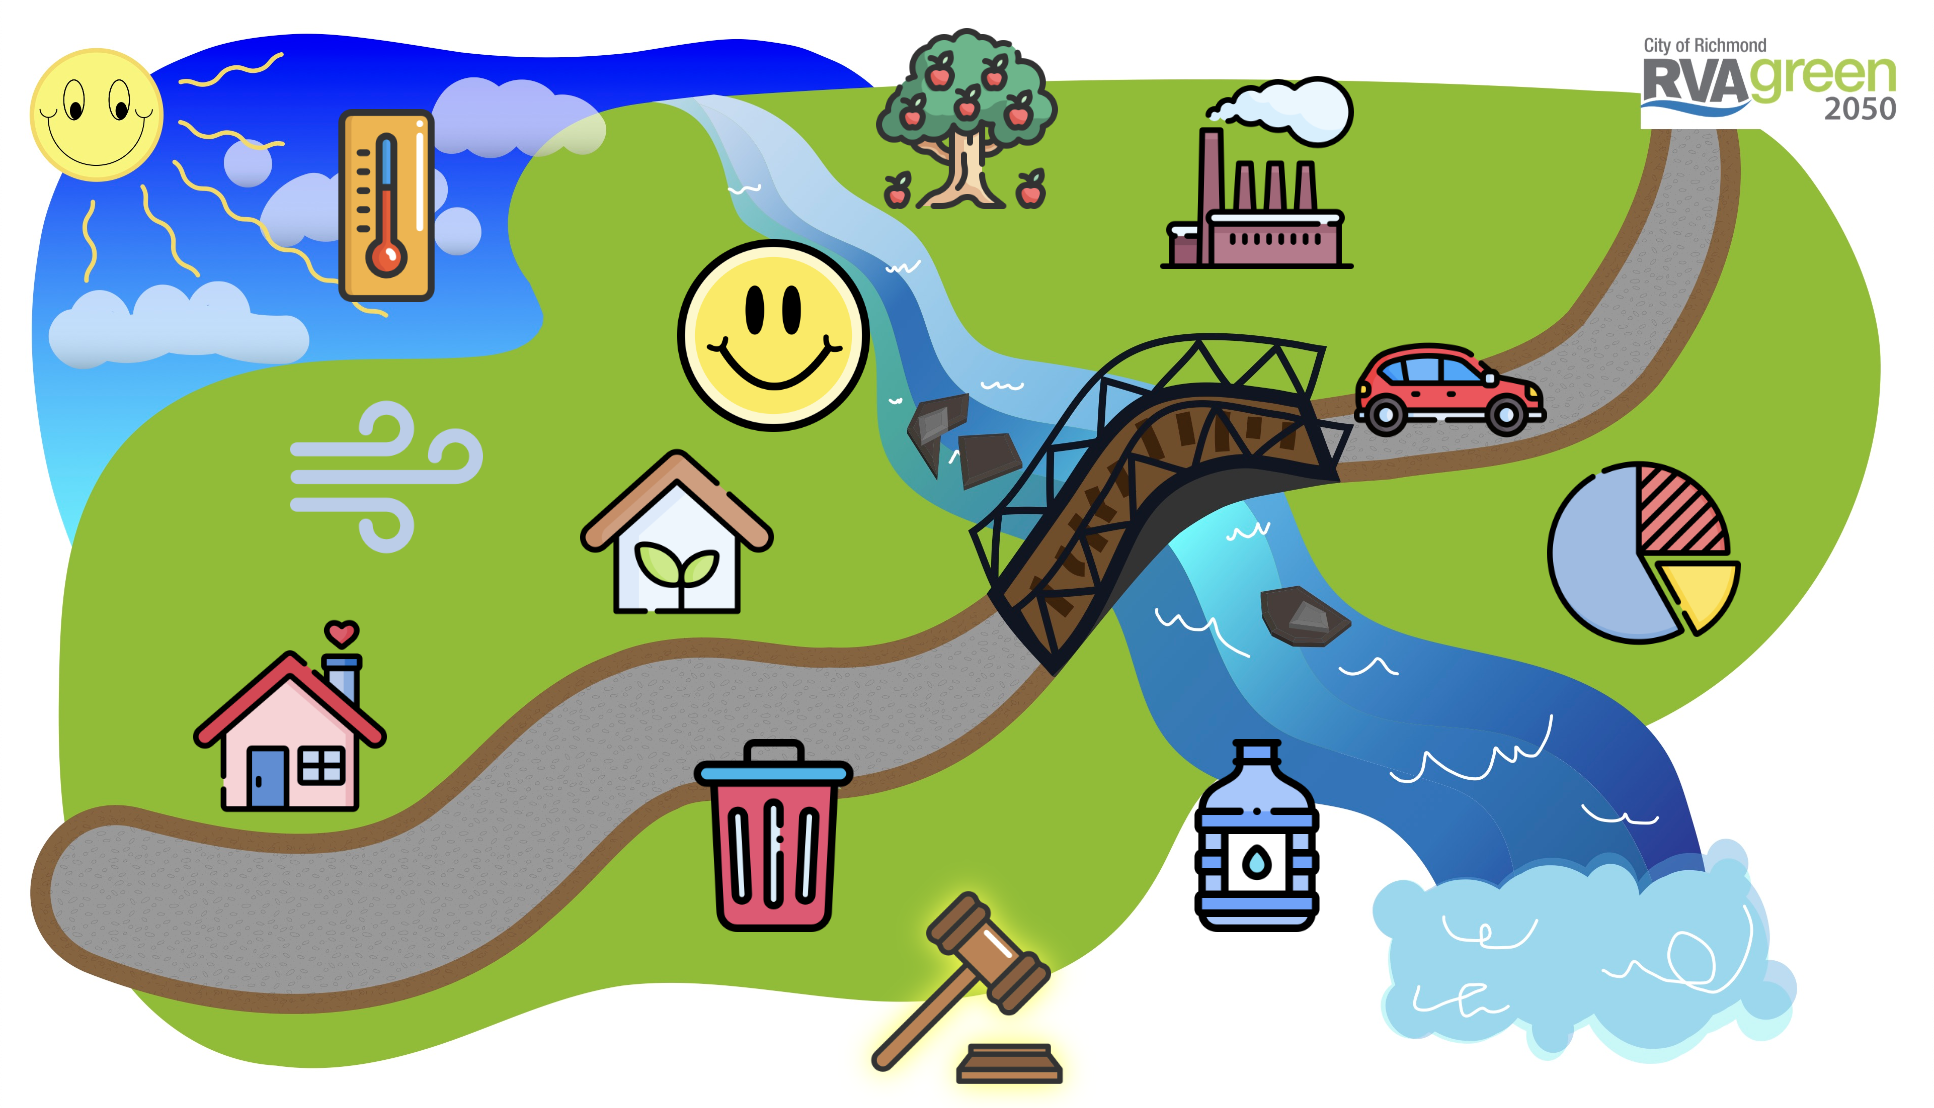
RVA Green
Website that visualizes the City of Richmond's Climate Equity Action Plan using React and a home-brewed Content Management System.

DSIRE API
RESTful API that allows searching and paginating data about Regulatory Policies and Financial Incentives for clean energy in each US state.

Break Free From Plastic
Web app that tracks plastic usage avoided through reuse systems at 25 stores in the Philippines. Check it out here!